
The Four Myths of Business Innovation: Part 2, Myth #1

MYTH: Gazelles (High Growth Startups) create the most net new jobs.
REALITY: Small Self-funded bootstrapped businesses create 99% of all NET new jobs.
There is a popular misconception that VC funded high-growth startups create the most net new jobs. I have done some research in this area and while VC funding is an important part of the startup ecosystem, it only represents a very small portion of the net new jobs created. New self-funded bootstrapped companies create the most net new jobs. I use two concepts to illustrate this point: “the startup hockey analogy” and “funding math”.
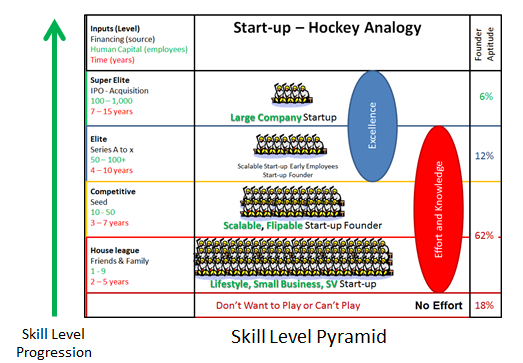
The Startup Hockey Analogy is based on the premise that the relative skill level of new business founders is similar to the skill distribution of professional athletes. The number of founder/athletes that can start and build a scalable startup (gazelle or high-growth startup) is very small. The NHL has roughly 1,000 players in North America from a population pool of 330 million. The assumption is that of all startups the relative distribution of companies by skill level is equivalent to the distribution of professional sports. Each level in the pyramid becomes increasingly more difficult to attain. Very few startups make it to the top tier and receive funding by an Initial Public Offering (IPO).
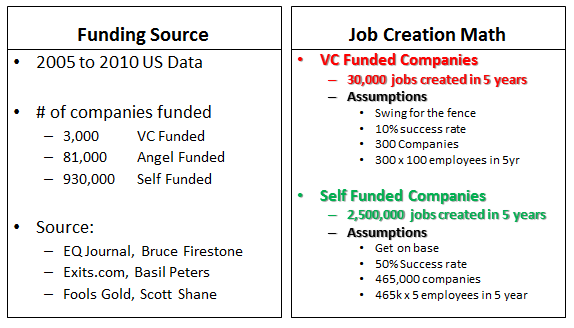
The “Funding Math” diagram categorizes early stage businesses by funding type: Self-Funded, Angel or VC. This diagram is based on US SBA incorporation, data from Basil Peters on Angel funding and Scott Shane’s book “Fool’s Gold”. The data by funding type is from 2005 to 2010 in the US and I often read “EQ Journal”, a blog by Dr. Bruce Firestone. Dr. Firestone had written the following post which gives insights into funding by type: “Things Every Tech Startup Needs to Know about Self-Capitalization. My assumption is that the funding numbers for Canada would be similar to the US 2005 to 2010 data if not skewed more toward self-funded companies because of the lack of VC funding. Therefore based on “Funding Math” calculation the number of NET NEW jobs created in the US between 2005 and 2010 by VC funded companies was 30,000 while self-funded and bootstrapped companies accounted for 2,500,000 NET NEW jobs in the US. Boot strapped and self-funded companies account for 99% of all NET NEW jobs.

Comments
Be the first to comment